Ghana Election 2024 Scenario/Prediction Tools
Background
The SP Analytica Election Scenario Model of Ghana’s presidential election estimates each major candidate’s chances of winning the national votes by providing scenarios of what percentages are required region by region. The model combines 2024 voter register, historical voter turnout, historical rejected ballots, and historical voting patterns of each region/constituency to predict the likelihood/scenarios of each party winning the election.
The Scenario engine
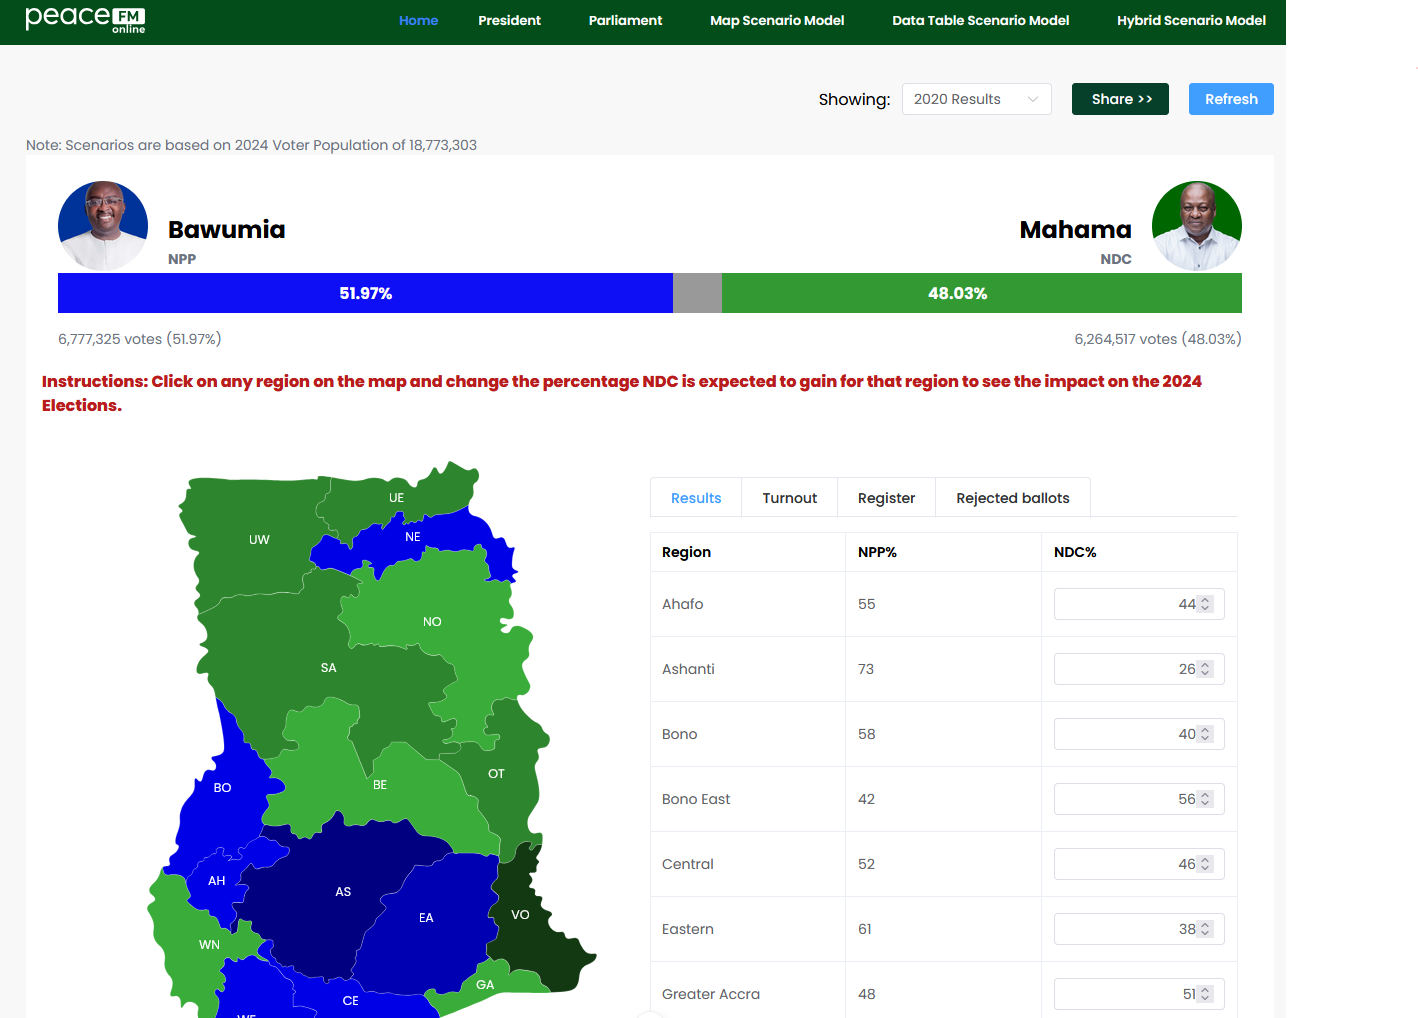
The scenario analysis model allows users to create their scenarios for regions and constituencies at a time – this is saved to the user’s device. Users can share the models or the outcome of their scenarios via email with family and friends. By default, the platform has been populated with percentages won by each party since 2020. Users can use any of these for a start and change them to run their scenarios.
Inputs to the model:
1. historical results percentages won by NPP and NDC
2. Rejected Ballots
3. Voter Turnout
4. Voter Register
Output to the model:
1. Percent by region/constituency required by each party to win the election
Scenario Analysis Model Types
There are 3 variations of the scenario analysis model
1. Data table scenario model
2. Map Scenario model
3. Hybrid (Map/Table) Scenario model
Data Table Scenario Model
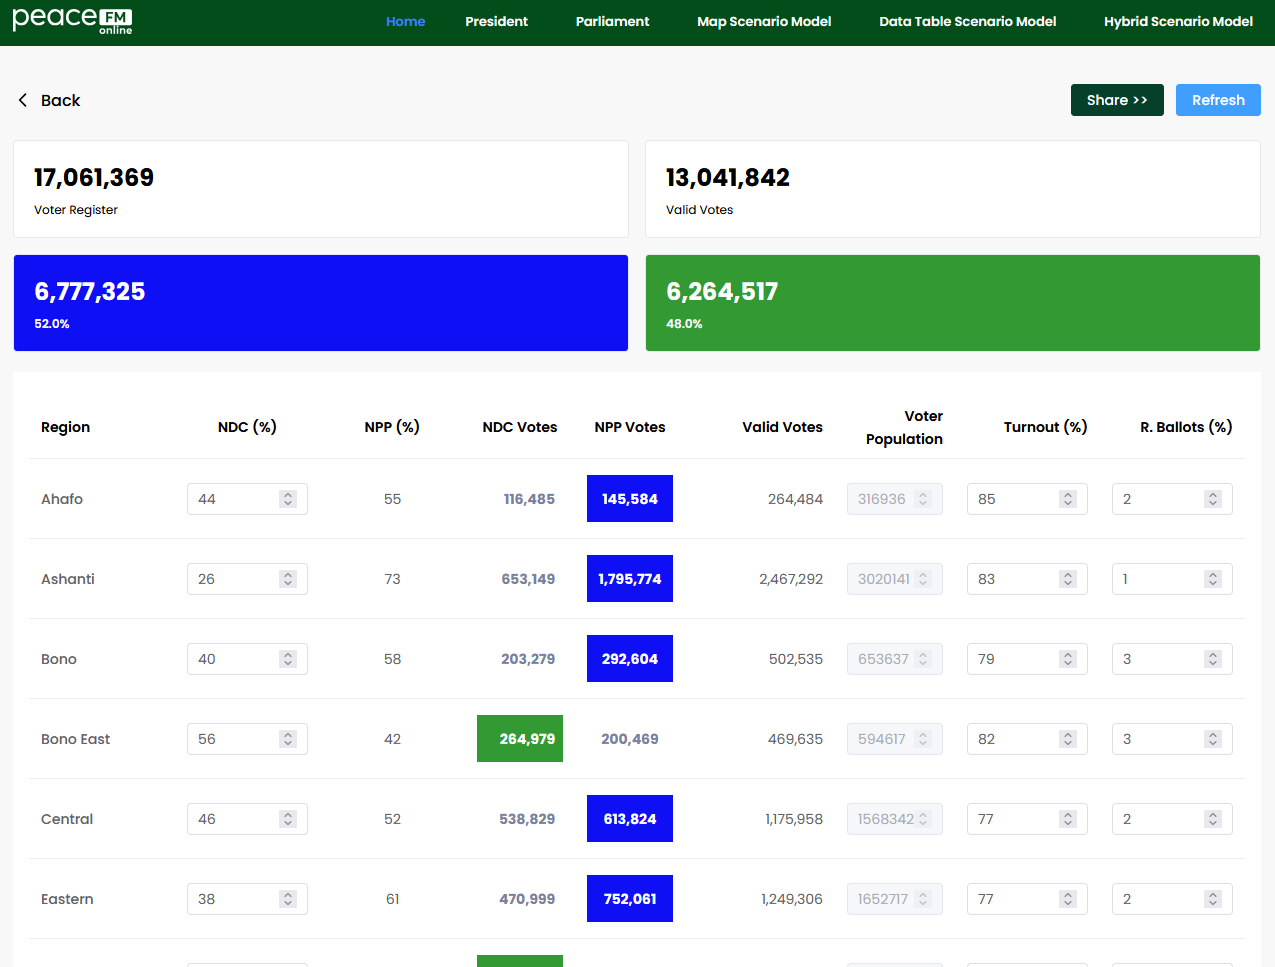
This version focuses on presenting data in tabular form for detailed numerical analysis. This is for the number of users who want to play with all variables of the model including voter turnout, voter register, rejected ballots and percents.
How it works:
1. User will create a scenario by selecting the voter register to use (default is 2024)
2. User selects which year’s election results to use
3. User then saves the scenario.
4. User can view results of the scenario by navigating to a particular scenario
5. User can change any of the input variables (turnout, rejected ballots, percent won) to see which party wins.
6. User have the ability to share the models via email with family and friends
Map Scenario model
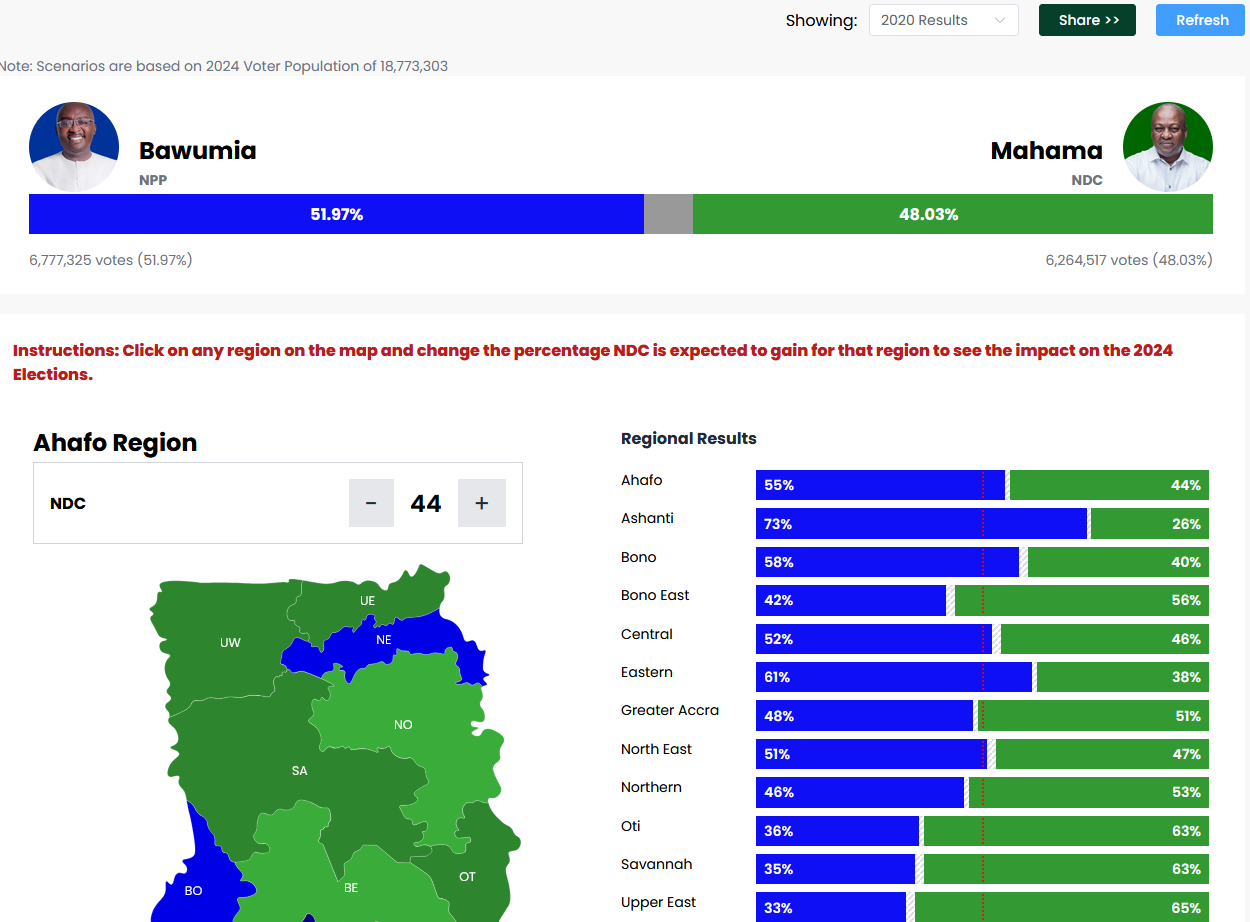
This version uses geographical data visualization to present election scenarios spatially across Ghana. It includes regional map of Ghana and an election bar which shows in real time percentages won as a user changes inputs to the model. The Ghana map shows colors of the winning party as user changes inputs to the scenario
How it works:
1. Scenario is by default loaded with 2024 register
2. User selects which year’s election results to use
3. User clicks region on the map and sets the voter percent for party
4. The changes are automatically reflected on the map and election bar
5. User can change any of the input variables (turnout, rejected ballots, percent won) to see which party wins.
6. User have the ability to share the models via email with family and friends
Hybrid Scenario model
This version Combines data tables with visual elements for a more integrated analytical approach
How it works:
1. Scenario is by default loaded with 2024 register
2. User selects which year’s election results to use
3. User then saves the scenario.
4. User can view results of the scenario by navigating to a particular scenario
5. User can change any of the input variables (turnout, rejected ballots, percent won) to see which party wins.
6. User have the ability to share the models via email with family and friends
